An Underrated Key to Academic Success
A Cross-Disciplinary Challenge
Whether in biology, psychology, engineering or economics – students across disciplines often struggle with the same issue: reading and understanding graphs. Three recent studies reveal independently that graph comprehension is a major bottleneck in student learning – and at the same time, a powerful opportunity for effective teaching.
What the Problem Is – and What It Isn’t
It’s often assumed that students’ difficulties lie in interpreting complex scientific results. However, these studies show that the real hurdle comes much earlier – in simply describing what graphs show and how they are structured.
Pelnar & Cameron (2025) interviewed students about their graph-reading skills and found three key insights:
- Students had never been asked to reflect on their mental processes when interpreting graphs.
- Many believed that graph reading is a skill one simply acquires naturally over time.
- Despite this belief, they consistently struggled with the task.
Students tend to:
- Skip reading axis labels or don’t mention them at all
- Fail to identify patterns or trends
- Jump to conclusions or interpretations without understanding the data
- Assume that “the graph speaks for itself” – even though they lack the vocabulary to describe it
The Decoding the Disciplines framework provides a valuable approach to addressing this bottleneck in student learning.
By following a structured seven-step process, it helps instructors identify the expert thinking and mental operations involved in tasks that students typically find difficult (see Fig. 1).
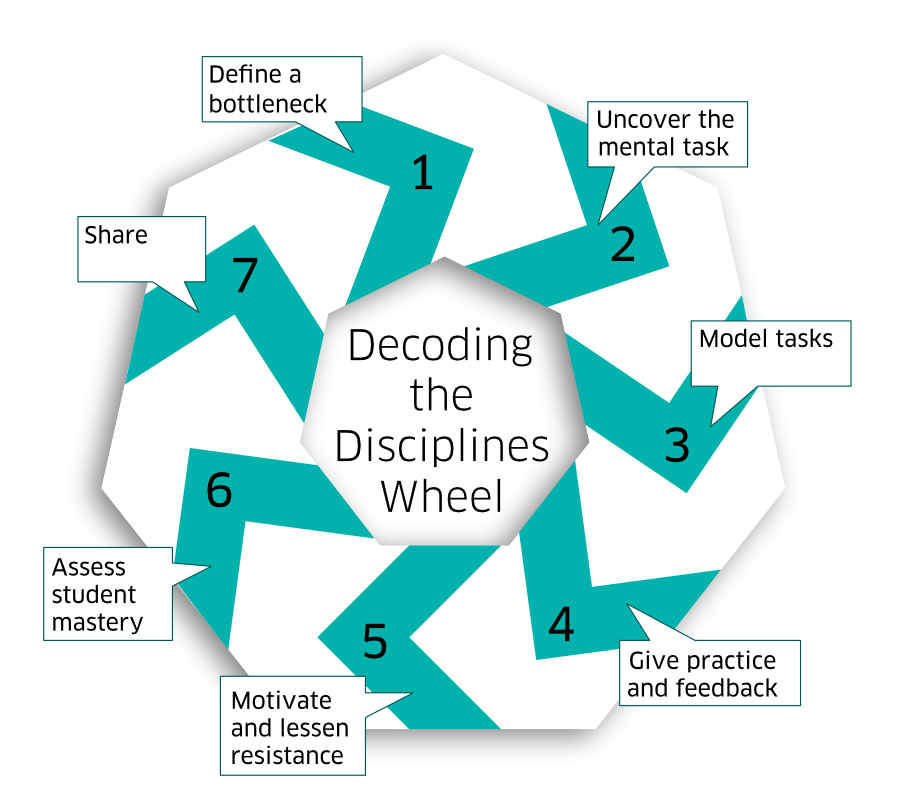
Figure 1. The decoding the discipline wheel with the seven steps of the process
Cameron and Duffy (2025) apply the Decoding the Disciplines framework in collaboration with experts from various fields, demonstrating that graph reading follows a similar pattern across disciplines and is best understood as an iterative rather than a linear process.
The Three Mental Steps of Reading a Graph
Although differeing in the denomination and Zusammenfassung, all studies exhibit the following stepfs of graph reading:
- Orientation
→ What are the axes? Which is the independent and which the dependent variable? What does the title and the legend say? - Pattern Recognition
→ What trends or structures are visible? Are there peaks, gaps, or plateaus? - Interpretation
→ What do these patterns mean within the disciplinary context?
Lisa Elliott and Joan Middendorf (2025) explicate the pattern of variability in data that faculty often identify intuitively – but students must be explicitly taught how to do this. The authors furthermore present an insight in the decoding process by using the trading analogy method.
Practical Solutions – Ready to Apply
Tara Darcy (2025) developed a graphing checklist that aligns perfectly with these three steps. Used in large introductory biology classes, it showed measurable results:
- Improved performance in assessments
- Increased student confidence in interpreting data
- Decreased dropout and failure rates
All articles emphasize: Graph reading is an iterative process. One moves back and forth between axes, patterns, and meaning – and this back-and-forth needs to be made visible to students.
Tips for Your Teaching Practice
- Introduce a checklist (as a handout or embedded in ILIAS or lecture slides)
- Practice verbal scaffolds like “The y-axis shows…”, “We can see a rising trend in…”
- Ask for descriptions without interpretations first – make students verbalize what they see before drawing conclusions
- Use analog methods like the “human graph” (students physically represent data points => see Elliot & Middendorf 2025)
- Use analogies (e.g., musical rhythm, Tupperware fitting, domino patterns) to explain hidden mental processes
Conclusion: A Small Teaching Move, A Big Impact on Data Literacy
Graph comprehension is more than a technical skill – it’s a conceptual tool. Teaching students to interpret visual data can fundamentally improve their ability to engage with academic content. With simple methods like checklists, analogies, and structured graph-reading practice, we can build a key 21st-century competency. The ZHQ is here to support teachers with consultation, materials, and training.
Cameron, E.L & Duffy, K. L. (2025). Using decoding the disciplines to elucidate the mental processes involved in eading graphical data. die hochschullehre, 11/2025. DOI: 10.3278/HSL2538W  . Link to article
Elliot, L. J. & Middendorf, J. (2025). Applying Decoding methodology to psychological statistics and other applications. die hochschullehre, Jahrgang 11/2025. DOI: 10.3278/ HSL2540W . Link to article
Pelnar, H. & Cameron, E. L. (2025). Using Decoding the Disciplines and students as partners to explore student graph reading. die hochschullehre, year 11/2025. DOI: 10.3278/ HSL2539W . Link to article
Darcy, T. (2025). Enhancing Graphical Literacy in Introductory Biology Students using the Decoding Disciplines Paradigm. die hochschullehre, Jahrgang 11/2025. DOI: 10.3278/HSL2537W . Link to article